An example of what can be done with open data
import requests # We import the requests library in order to be able to do http requests

url = "http://developers.market/api/v1/contributions"
try:
    r = requests.get(url)
except requests.ConnectionError:
    print("Connection failed")
import pandas as pd # importing the pandas python library commonly used in data science
from pandas.io.json import json_normalize # importing json normalize to flatten the json output
df = json_normalize(r.json()) # storing the flattened output to a pandas dataframe
# The following call serves to convert the date type data to date type instead of JSON strings
for col in ['commit_date', 'calculation_utc_datetime']:
  df[col] = df[col].apply(pd.to_datetime)
# The following call serves to convert the date type data to numerical types instead of JSON strings
for col in ['git_project.id', 'git_project.project_value','id', 'transaction.id', 'transaction.nb_sdg', 'transaction.project.id', 'transaction.project.project_value', 'transaction.project.project_value', 'transaction.to_user', 'transaction.to_user.id']:
  df[col] = df[col].apply(pd.to_numeric)
# The following call serves to drop columns that I considered unuseful
df = df.drop('transaction.to_user.active', axis=1).drop('transaction.to_user.black_listed', axis=1).drop('transaction.to_user.email', axis=1).drop('transaction.to_user.github_id',axis=1).drop('transaction.to_user.name', axis=1).drop('transaction.to_user.roles', axis=1).drop('transaction.to_user.timezone', axis=1).drop('transaction.to_user.username', axis=1)
df.dtypes
Out[53]:
calculation_utc_datetime datetime64[ns]
commit_date datetime64[ns]
commit_id object
committer_email object
committer_username object
git_project.active bool
git_project.created_by float64
git_project.created_by.active object
git_project.created_by.black_listed object
git_project.created_by.email object
git_project.created_by.github_id object
git_project.created_by.id float64
git_project.created_by.name object
git_project.created_by.roles object
git_project.created_by.timezone object
git_project.created_by.username object
git_project.git_address object
git_project.id int64
git_project.name object
git_project.project_address object
git_project.project_value int64
id int64
transaction.created_at object
transaction.from_user object
transaction.id int64
transaction.nb_sdg float64
transaction.nb_tokens float64
transaction.project.active bool
transaction.project.created_by float64
transaction.project.created_by.active object
transaction.project.created_by.black_listed object
transaction.project.created_by.email object
transaction.project.created_by.github_id object
transaction.project.created_by.id float64
transaction.project.created_by.name object
transaction.project.created_by.roles object
transaction.project.created_by.timezone object
transaction.project.created_by.username object
transaction.project.git_address object
transaction.project.id int64
transaction.project.name object
transaction.project.project_address object
transaction.project.project_value int64
transaction.sell_offer object
transaction.to_user float64
transaction.to_user.id float64
transaction.transaction_label object
dtype: object
df[['commit_date', 'transaction.nb_tokens', 'committer_username']].sample(5)
# Here I display a view of the data I get back concentrated on the three columns I consider most important for my plot
Out[54]:
commit_date transaction.nb_tokens committer_username
975 2019-07-15 16:54:35 0.01 GitHub
73 2019-03-13 13:38:22 0.74 Xoeseko
144 2018-10-24 07:52:01 44.15 gilles-hemmerle
312 2019-04-05 19:42:03 0.21 Xoeseko
915 2018-11-26 06:08:41 1.13 Nicolas B
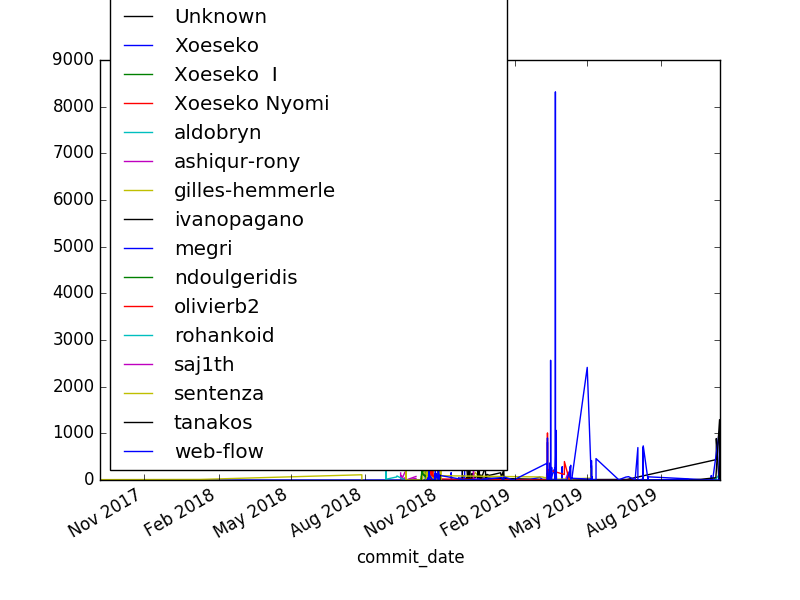
import matplotlib.pyplot as plt

fig, ax = plt.subplots()

users = df.groupby('committer_username')
for key, user in users:
  user.plot(ax=ax, kind='line', x='commit_date', y='transaction.nb_tokens', label=key)

img = plt.show()
display(img) # Notation is specific to databricks otherwise plt.show would output graph in a popup